Fig. 7
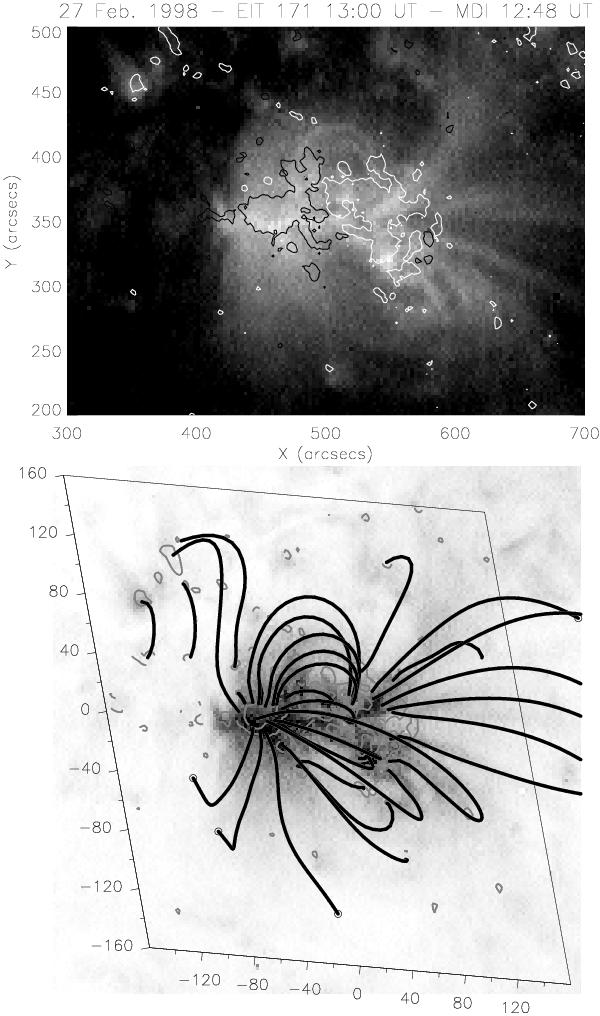
(Top) EIT image in 171 Å at 13:00 UT on February 27, 1998, with two MDI isocontours overlaid (± 100 G) shown with continuous lines (positive: white line, negative: black line). The MDI magnetogram was taken at 12:48 UT. (Bottom) The same EIT image with more isocontours (± 100, 500 G) shown with gray lines and computed field lines superimposed (black continuous lines). Both axes are measured in Mm in the local solar frame.
Current usage metrics show cumulative count of Article Views (full-text article views including HTML views, PDF and ePub downloads, according to the available data) and Abstracts Views on Vision4Press platform.
Data correspond to usage on the plateform after 2015. The current usage metrics is available 48-96 hours after online publication and is updated daily on week days.
Initial download of the metrics may take a while.