Fig. 4
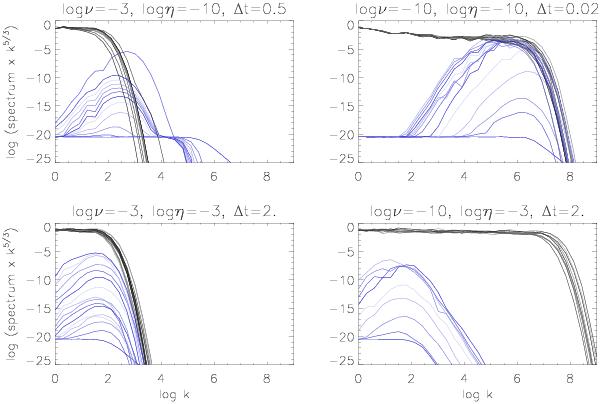
Evolution of the spectra (compensated by k5/3) of kinetic energy (black) and magnetic energy (blue), for different sets of initial Reynolds numbers (Re,Rm) (shown as green triangles in Fig. 1), for the weakly nonlocal Sabra model. The spectra are averaged over ten independent runs and are plotted at time intervals shown as Δt in the plot titles. The different shades are a guide for understanding the direction of time (from black to gray and from dark to light blue, cycling every five spectra).
Current usage metrics show cumulative count of Article Views (full-text article views including HTML views, PDF and ePub downloads, according to the available data) and Abstracts Views on Vision4Press platform.
Data correspond to usage on the plateform after 2015. The current usage metrics is available 48-96 hours after online publication and is updated daily on week days.
Initial download of the metrics may take a while.