Fig. 8
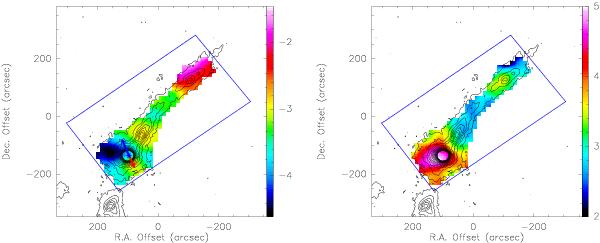
Left panel: MOPRA N2H+ velocity distribution with dust continuum LABOCA 870 μm emission in contours. Red and blue arrows indicate the rough direction of the red and blue CO outflow lobes detected towards IRAS 17233–3606 respectively. Right panel: MOPRA N2H+ line width distribution (FWHM) with dust continuum LABOCA 870 μm emission in contours. In both maps, background image units are in kms-1, and only those pixels that correspond to N2H+ integrated intensity >2.4Jy km s-1 have been considered significant.
Current usage metrics show cumulative count of Article Views (full-text article views including HTML views, PDF and ePub downloads, according to the available data) and Abstracts Views on Vision4Press platform.
Data correspond to usage on the plateform after 2015. The current usage metrics is available 48-96 hours after online publication and is updated daily on week days.
Initial download of the metrics may take a while.