Free Access
Fig. 6
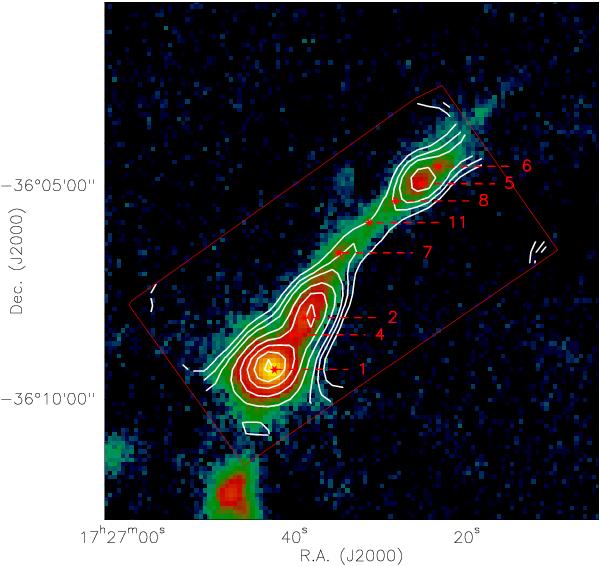
MOPRA N2H+ moment zero map in contours overlaid on the LABOCA 870 μm emission. The red rectangle shows the approximate area mapped with MOPRA. Clump labelling is the same as adopted through out the text. The contours have been chosen to start at 3σ, 5σ in steps of 3σ where σ = 1.4 Jy kms-1.
Current usage metrics show cumulative count of Article Views (full-text article views including HTML views, PDF and ePub downloads, according to the available data) and Abstracts Views on Vision4Press platform.
Data correspond to usage on the plateform after 2015. The current usage metrics is available 48-96 hours after online publication and is updated daily on week days.
Initial download of the metrics may take a while.