Fig. 3
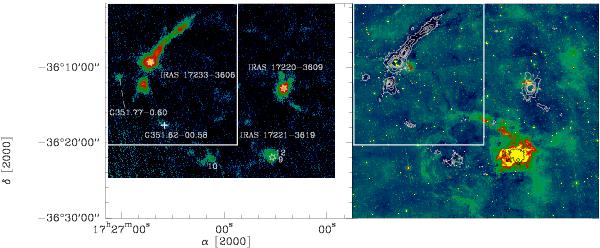
Left: continuum emission at 870 μm of the environment around G351.77−0.51. The numbers label the clumps found by the CLUMPFIND algorithm outside the region plotted in Fig. 1. The white cross marks the position G351.62, the stars the IRAS sources found in the region. Right: image of the emission at 8 μm of the molecular environment around G351.77−0.51. The white (and black for IRAS 17221–3619) contours show the emission at 870 μm from 0.255 (3σ) to 4 Jy/beam in step of 10σ. In both panels, the white box outlines the region plotted in Fig. 1.
Current usage metrics show cumulative count of Article Views (full-text article views including HTML views, PDF and ePub downloads, according to the available data) and Abstracts Views on Vision4Press platform.
Data correspond to usage on the plateform after 2015. The current usage metrics is available 48-96 hours after online publication and is updated daily on week days.
Initial download of the metrics may take a while.