Free Access
Fig. 1
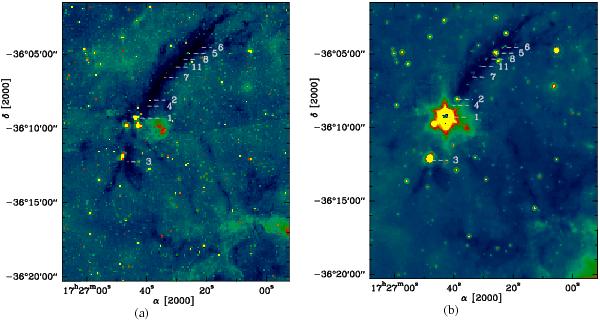
Image of the 8 μm (left) and 24 μm (right) emission from Spitzer of the molecular cloud G351.77−0.51. The numbers label the 870 μm dust continuum clumps found by the CLUMPFIND procedure and discussed in the text (see Table 3).
This figure is made of several images, please see below:
Current usage metrics show cumulative count of Article Views (full-text article views including HTML views, PDF and ePub downloads, according to the available data) and Abstracts Views on Vision4Press platform.
Data correspond to usage on the plateform after 2015. The current usage metrics is available 48-96 hours after online publication and is updated daily on week days.
Initial download of the metrics may take a while.