Fig. 1
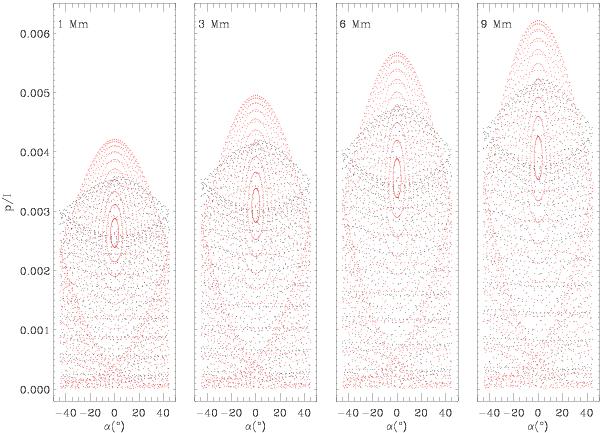
Polarization diagrams computed for different heights above the solar surface (from 1 Mm in the leftmost frame to 9 Mm in the rightmost frame). In every diagram, the y-axis gives the degree of linear polarization  , the x-axis the polarization angle α = 0.5 tan-1(U/Q). p represents the maximum in the wavelength range covered by the He i multiplet. The plotted α has been sampled at the same wavelength. Red points correspond to “vertical” magnetic fields (θB < 54.7° or θB > 125.3°), while black points correspond to “horizontal” magnetic fields (54.7° < θB < 125.3°).
Current usage metrics show cumulative count of Article Views (full-text article views including HTML views, PDF and ePub downloads, according to the available data) and Abstracts Views on Vision4Press platform.
Data correspond to usage on the plateform after 2015. The current usage metrics is available 48-96 hours after online publication and is updated daily on week days.
Initial download of the metrics may take a while.