Fig. 6
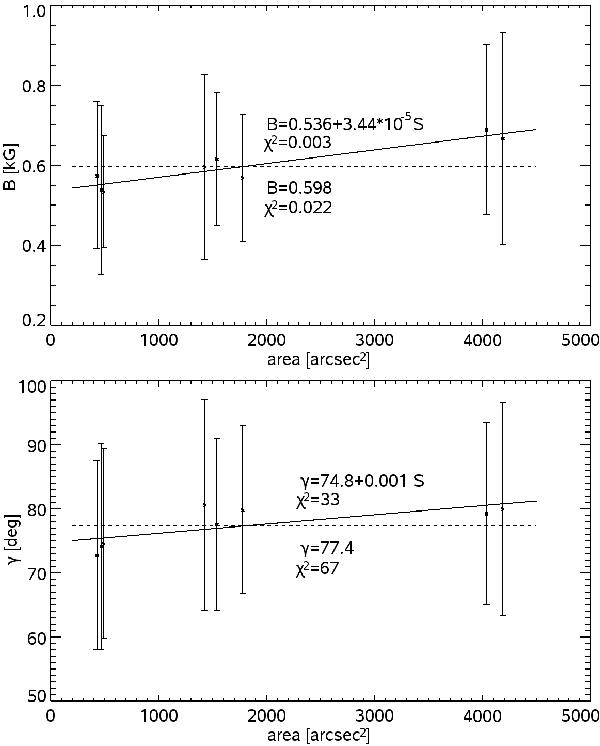
Plots of magnetic field strength (top) and inclination (bottom) reached at the outer penumbral boundaries as a function of sunspot area. The errorbars mark the standard deviations. The solid and dashed lines represent the linear and constant fit of the B and γ values, respectively. The parameters of the fit along with χ2 values are written in the plots.
Current usage metrics show cumulative count of Article Views (full-text article views including HTML views, PDF and ePub downloads, according to the available data) and Abstracts Views on Vision4Press platform.
Data correspond to usage on the plateform after 2015. The current usage metrics is available 48-96 hours after online publication and is updated daily on week days.
Initial download of the metrics may take a while.