Fig. 3
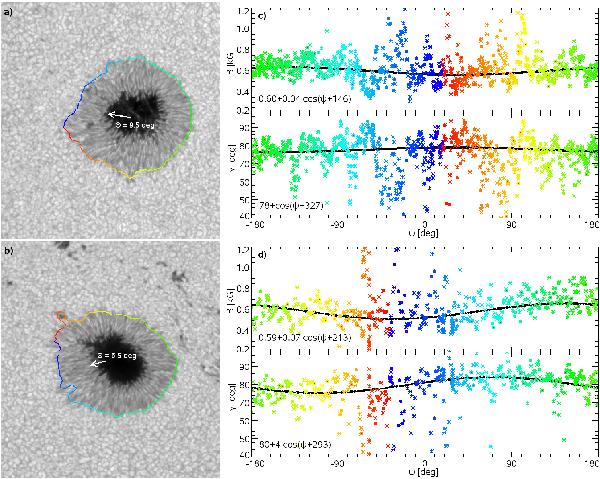
Maps of continuum intensity (a, b)) with marked penumbral boundaries 5P and 6P, respectively. The white arrows are analogous to those in Fig 1. Plots c, d) show the magnetic field strengths (top) and inclination (bottom) dependent on the position along the penumbral boundaries. The colours of symbols correspond to the position on the boundary. The small black symbols are the fits of the observed values with formulas written in the plots.

Current usage metrics show cumulative count of Article Views (full-text article views including HTML views, PDF and ePub downloads, according to the available data) and Abstracts Views on Vision4Press platform.
Data correspond to usage on the plateform after 2015. The current usage metrics is available 48-96 hours after online publication and is updated daily on week days.
Initial download of the metrics may take a while.