Fig. 2
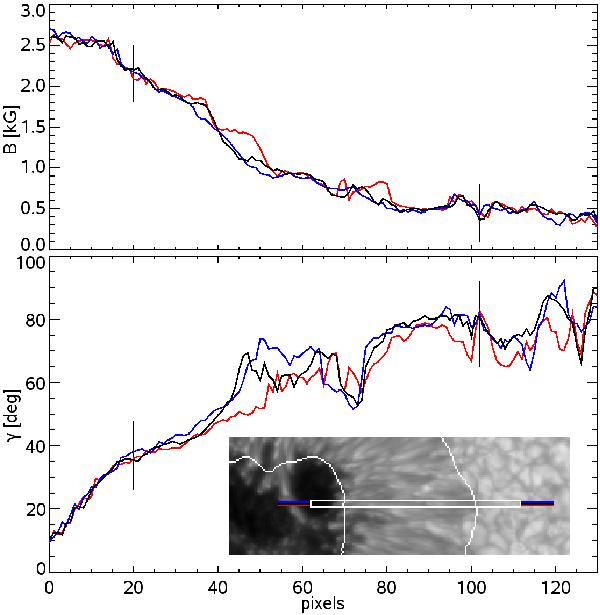
Changes in magnetic field strength (upper plot) and inclination (lower plot) along three paths across the penumbra. In the lower right part is the continuum intensity map with marked region with the three shown paths and their colour codes. The black lines in the plots of plasma parameters correspond to the penumbral boundaries shown in the continuum map.
Current usage metrics show cumulative count of Article Views (full-text article views including HTML views, PDF and ePub downloads, according to the available data) and Abstracts Views on Vision4Press platform.
Data correspond to usage on the plateform after 2015. The current usage metrics is available 48-96 hours after online publication and is updated daily on week days.
Initial download of the metrics may take a while.