Fig. 13
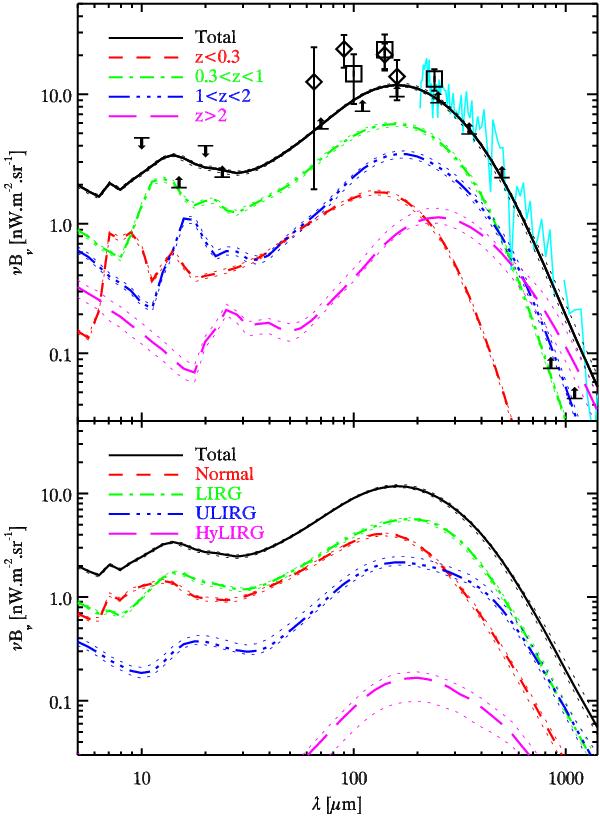
Upper panel: contribution to the CIB per redshift slice. Black solid line: CIB spectrum predicted by the model. Red short-dashed line: contribution of the galaxies between z = 0 and 0.3. Green dot-dash line: same thing between z = 0.3 and 1. Blue three dot-dash line: same thing between z = 1 and 2. Purple long-dashed line: contribution of the galaxies at redshift higher than 2. Black arrows: lower limits coming from the number counts at 15 μm (Hopwood et al. 2010) and 24 μm (Béthermin et al. 2010a) and the stacking analysis at 70 μm (Béthermin et al. 2010a), 100 μm, 160 μm (Berta et al. 2010), 250 μm, 350 μm, 500 μm (Marsden et al. 2009), 850 μm (Greve et al. 2010), and 1.1 mm (Scott et al. 2010) and upper limits coming from absorption of the TeV photons of Stecker & de Jager (1997) at 20 μm and Renault et al. (2001) between 5 μm and 15 μm. Black diamonds: Matsuura et al. (2011) absolute measurements with AKARI. Black square: Lagache et al. (2000) absolute measurements with DIRBE/WHAM. Cyan line: Lagache et al. (2000) FIRAS measurement. Lower panel: contribution to the CIB of the normal galaxies (red short-dashed line), LIRGs (green dot-dash line), ULIRGs (blue three dot-dash line), HyLIRG (purple long-dashed line), and all the galaxies (black solid line).
Current usage metrics show cumulative count of Article Views (full-text article views including HTML views, PDF and ePub downloads, according to the available data) and Abstracts Views on Vision4Press platform.
Data correspond to usage on the plateform after 2015. The current usage metrics is available 48-96 hours after online publication and is updated daily on week days.
Initial download of the metrics may take a while.