Free Access
Fig. 1
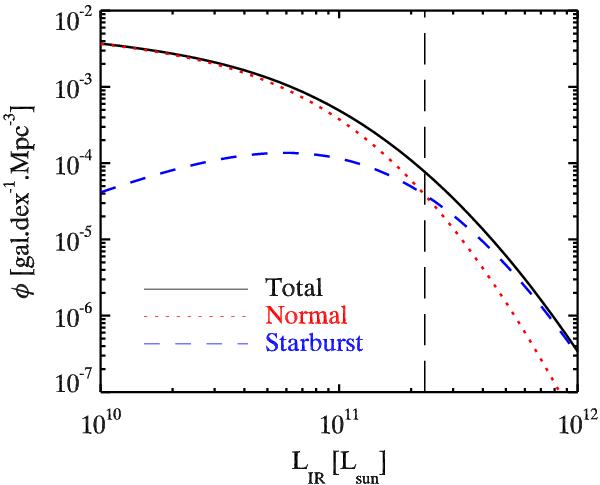
Solid line: local infrared bolometric luminosity function from our best-fit model. Red dotted line: contribution of the normal galaxies. Blue dashed line: contribution of the starburst galaxies. Black vertical long dashed line: luminosity of the transition between the two population (Lpop).
Current usage metrics show cumulative count of Article Views (full-text article views including HTML views, PDF and ePub downloads, according to the available data) and Abstracts Views on Vision4Press platform.
Data correspond to usage on the plateform after 2015. The current usage metrics is available 48-96 hours after online publication and is updated daily on week days.
Initial download of the metrics may take a while.