Fig. 8
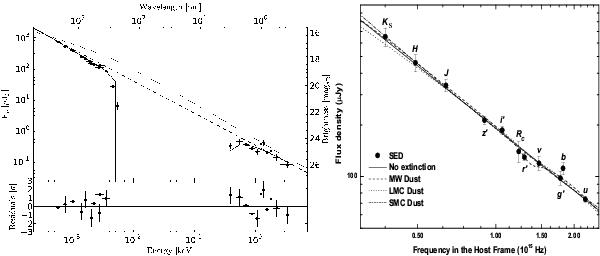
The observed SED of the X-ray/optical/NIR afterglow of GRB 080928 at t = 20 ks after correction for Galactic extinction by dust (Table 3) and Galactic absorption by gas. Left: the joint X-ray/optical SED is almost a pure power law (dashed line) affected by only a small amount of host extinction by dust (Table 4) and 3.5 × 1021 cm-2 of host absorption by the gas. The UV bands are affected by Lyman drop-out. The dotted line represents the SED that follows from the numerical energy injection model for this particular time, which slightly overpredicts the flux in the X-ray band (see Sect. 3.2.3). Residuals refer to the the plot with βOX = 1.02 (broken line). Right: zoom-in to the optical/NIR SED, and the different dust models used to fit the data, where it is possible to discern the dip resulting from the 2175 Å feature.
Current usage metrics show cumulative count of Article Views (full-text article views including HTML views, PDF and ePub downloads, according to the available data) and Abstracts Views on Vision4Press platform.
Data correspond to usage on the plateform after 2015. The current usage metrics is available 48-96 hours after online publication and is updated daily on week days.
Initial download of the metrics may take a while.