Fig. 3
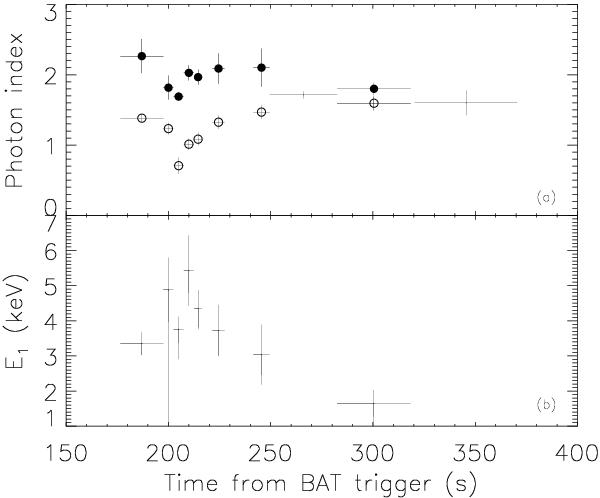
Spectral parameters of the prompt emission using the time-resolved XRT-BAT-GBM data. a) The evolution of the photon index from fits to BAT-GBM and XRT data. Open circles show the low-energy index  below the break energy E1 of a single broken power law and the filled circles represent the high-energy index
  above E1. Points with no plot symbols (error bars only) are the best-fit results using only a simple power law. b) The low-energy break energy, E1, from fits to the BAT and XRT data. During the flare at 208 s spectral evolution is seen, similar to what was also detected in other afterglows (e.g., Falcone et al. 2007).
Current usage metrics show cumulative count of Article Views (full-text article views including HTML views, PDF and ePub downloads, according to the available data) and Abstracts Views on Vision4Press platform.
Data correspond to usage on the plateform after 2015. The current usage metrics is available 48-96 hours after online publication and is updated daily on week days.
Initial download of the metrics may take a while.