Fig. 10
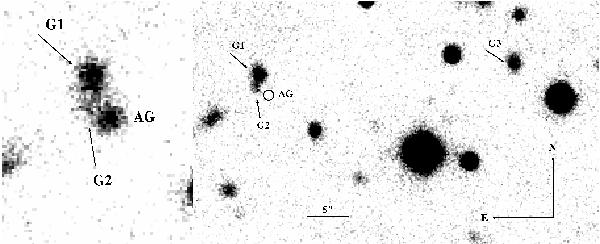
Left: zoom-in of the GROND combined g′r′i′z′-band image obtained 1.74 days after the burst at a seeing of 1 5. It shows the afterglow (AG) and the brightest galaxies close to it. Right: zoom-in of the stacked GROND optical g′r′i′z′-band images obtained on May 15, 2009, 6.5 months after the burst (5th epoch) when the afterglow had faded away. It also shows the galaxy (G3) that was coincidentally covered by the slit of the spectrograph when the redshift of the afterglow was measured with the ESO/VLT (Vreeswijk et al. 2008; Fynbo et al. 2009). Data for G1 to G3 are summarized in Table 6.
Current usage metrics show cumulative count of Article Views (full-text article views including HTML views, PDF and ePub downloads, according to the available data) and Abstracts Views on Vision4Press platform.
Data correspond to usage on the plateform after 2015. The current usage metrics is available 48-96 hours after online publication and is updated daily on week days.
Initial download of the metrics may take a while.