Fig. 1
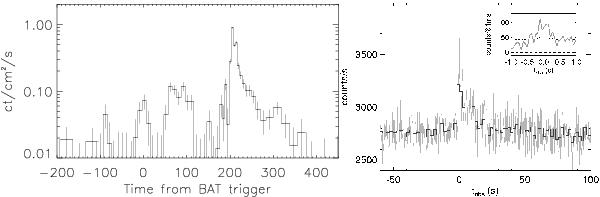
Left: the light curve of GRB 080928 as seen by Swift/BAT. Swift triggered at the gamma-ray peak at t0 = 0, which was followed by at least two more peaks with the maximum at t0 + 204 s. There may be a faint precursor of the main burst at t0 − 90 s. Right: Fermi/GBM light curve of the NaI detectors #0, #3, #4, and #7 combined with 2 s resolution (black line) and 0.256 s resolution (gray line). A zoom into the 64 ms-binned, background-subtracted light curve around the peak is shown in the inset. Variability on time scales of ~128 ms is detected at 3σ (solid gray line) above the background plus shot noise fluctuations. In this figure the time zero-point is the Fermi/GBM trigger time t0,GBM (Eq. (1)).
Current usage metrics show cumulative count of Article Views (full-text article views including HTML views, PDF and ePub downloads, according to the available data) and Abstracts Views on Vision4Press platform.
Data correspond to usage on the plateform after 2015. The current usage metrics is available 48-96 hours after online publication and is updated daily on week days.
Initial download of the metrics may take a while.