Fig. 5
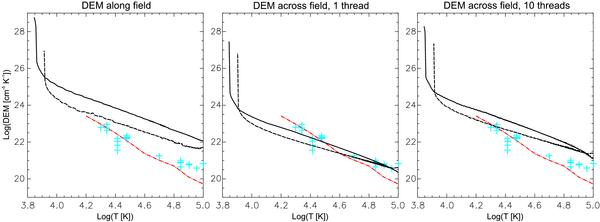
Synthetic DEM curves for Model1 (solid lines) and Model2 (dashed lines), and the DEM values derived from observations from Parenti & Vial (2007) (red dash-dotted line) and Cirigliano et al. (2004) (blue crosses). The left panel displays the synthetic DEM curves for single-thread models obtained with the LOS parallel to the magnetic field. The middle panel shows synthetic DEM curves for single-thread models obtained with the LOS perpendicular to the magnetic field. The right panel displays the synthetic DEM curves for multi-thread models each with ten randomly shifted threads.
Current usage metrics show cumulative count of Article Views (full-text article views including HTML views, PDF and ePub downloads, according to the available data) and Abstracts Views on Vision4Press platform.
Data correspond to usage on the plateform after 2015. The current usage metrics is available 48-96 hours after online publication and is updated daily on week days.
Initial download of the metrics may take a while.