Fig. 7
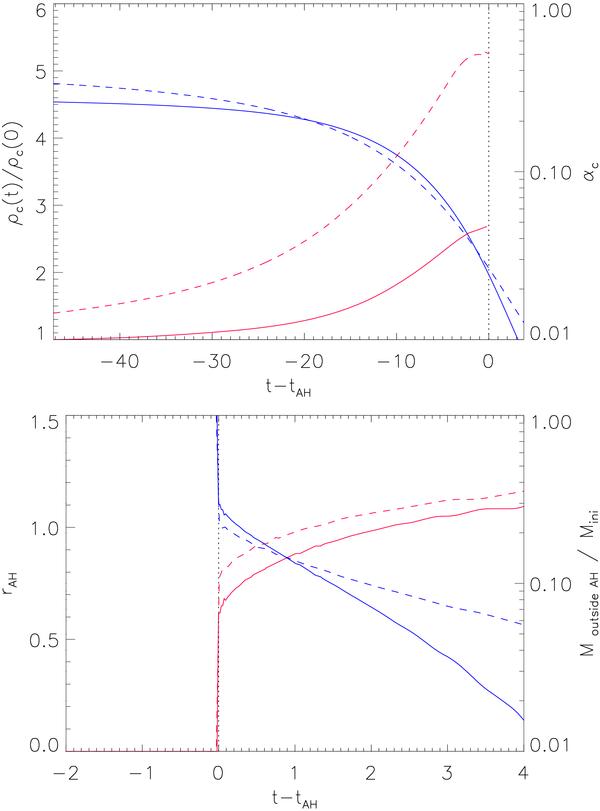
Collapse to BH. Upper panel: the monotonically rising red curves represent the evolution of the central density with respect to the intial value ρc/ρc(t = 0) (as explained in the text the curves are truncated at the formation of the apparent horizon), while the monotonically decreasing blue curves represent the value of the lapse α at the origin. Solid lines indicate the spherically symmetric collapse and dashed lines the collapse of the rotating NS model D4. Bottom panel: the rising red curves represent the radius of the apparent horizon, while the decreasing blue curves are the ratio of the rest mass outside the apparent horizon with respect to the total rest mass. Again, solid lines indicate the spherically symmetric collapse and dashed lines the collapse of the rotating NS model D4. The vertical dotted line indicates the time tAH when the apperent horizon forms.
Current usage metrics show cumulative count of Article Views (full-text article views including HTML views, PDF and ePub downloads, according to the available data) and Abstracts Views on Vision4Press platform.
Data correspond to usage on the plateform after 2015. The current usage metrics is available 48-96 hours after online publication and is updated daily on week days.
Initial download of the metrics may take a while.