Fig. 4
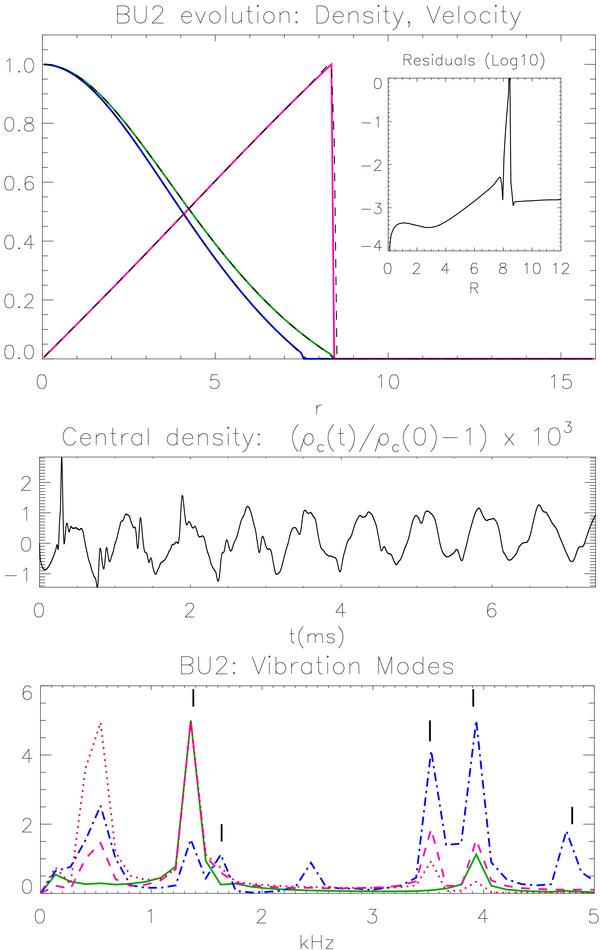
Evolution of a stable BU2 solution. The upper panel shows a comparison between the initial values (solid lines) of equatorial (green) and axial (blue) densities and of equatorial rotational velocity v (magenta), against the value of the same quantities at at tmax = 1500 (dashed lines). The densities are normalized to the central initial value ρc, the velocity to its maximum initial value (0.1619). The insert shows the relative difference between the equatorial densities as a function of radius. The spike at r ≈ 8 is due to diffusion at the NS surface, also partly visible in the velocity profile. The middle panel shows the variation in time of the central density. The bottom panel shows the Fourier transform of the the density (green solid line), vr (red dotted line), vφ (magenta dashed line), and vθ (blue dot-dashed line), at the point r = 3.0, θ = 45° of model BU2. The vertical markers indicate the frequency of known eigenmodes. The frequency resolution of our time series is ~150 Hz.

Current usage metrics show cumulative count of Article Views (full-text article views including HTML views, PDF and ePub downloads, according to the available data) and Abstracts Views on Vision4Press platform.
Data correspond to usage on the plateform after 2015. The current usage metrics is available 48-96 hours after online publication and is updated daily on week days.
Initial download of the metrics may take a while.