Fig. 3
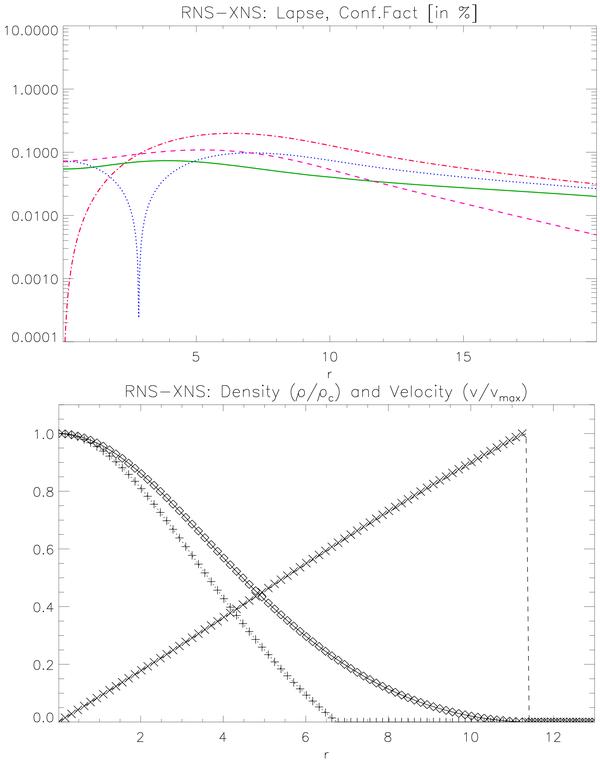
Comparison between RNS and XNS solutions for model BU8. The upper panel shows the fluid quantities. The solid (dotted) line represents the density at the equator (polar axis) derived using RNS, both normalized against ρc. The dashed line is the profile of the rotational velocity module v, normalized to its maximum (0.37462). Diamonds, crosses and pluses represent values of the same quantities as derived using XNS, where we report one symbol every 5 radial points for clarity. The lower panel shows the residual of various metric terms at the equator. The green solid line is the relative error between the lapse α computed with XNS and RNS. Dashed magenta and dotted blue lines represent the relative error between the conformal factor ψ of the CFC metric with respect to the one in quasi-isotropic coordinates and the quantity [R/(rsinθ)] 1/2. The dot-dashed red line represents the difference between ψ and [R/(rsinθ)] 1/2 both computed in quasi-isotropic coordinates, and can be considered a measure of the non conformal flatness of the RNS solution.
Current usage metrics show cumulative count of Article Views (full-text article views including HTML views, PDF and ePub downloads, according to the available data) and Abstracts Views on Vision4Press platform.
Data correspond to usage on the plateform after 2015. The current usage metrics is available 48-96 hours after online publication and is updated daily on week days.
Initial download of the metrics may take a while.