Fig. 2
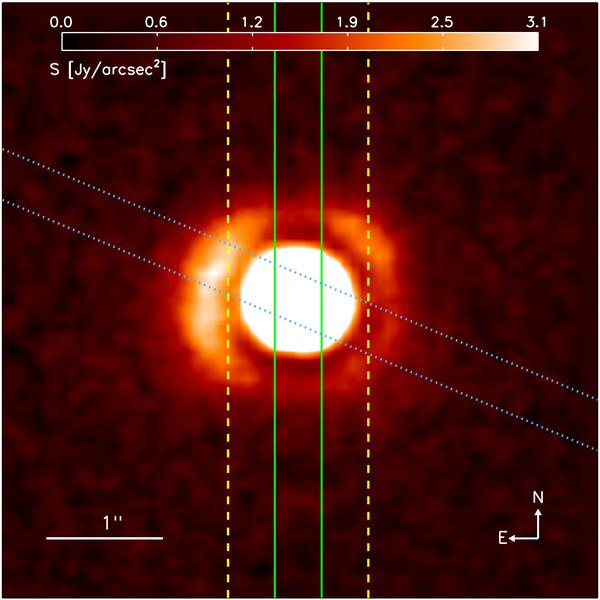
Observed 18.72 μm VISIR image. The color bar shows the surface brightness in Jy/arcsec2. Overplotted are the positions of the VISIR and TIMMI2 spectroscopic slits. The VISIR N-band slit position is plotted with the green straight line, the VISIR Q-band slit position is plotted with the blue dotted line and the TIMMI2 N-band spectrum is plotted with the yellow dashed line. The Spitzer slit encompasses the entire image.
Current usage metrics show cumulative count of Article Views (full-text article views including HTML views, PDF and ePub downloads, according to the available data) and Abstracts Views on Vision4Press platform.
Data correspond to usage on the plateform after 2015. The current usage metrics is available 48-96 hours after online publication and is updated daily on week days.
Initial download of the metrics may take a while.