Fig. 13
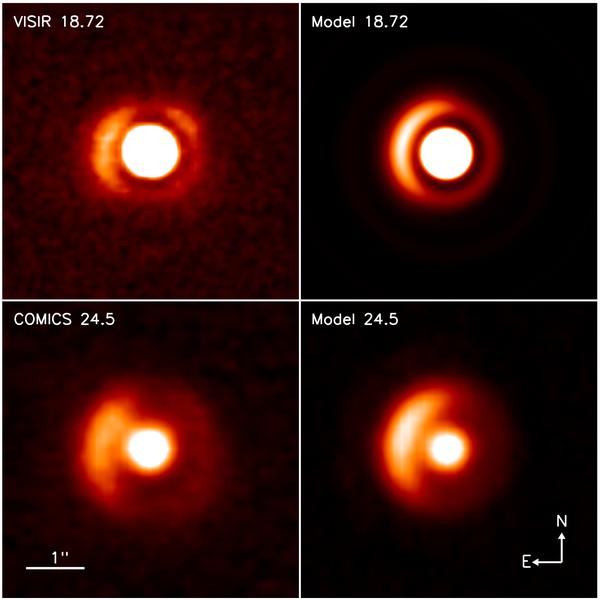
Comparison of the VISIR 18.72 μm (upper left), COMICS 24.5 μm (bottom left), and their modeled images (to the right). The model images were obtained by convolving the model output at the specified wavelengths with the observed PSFs. For a clear comparison the observed and modeled images were displayed with the same lower and upper flux level cut-offs.
Current usage metrics show cumulative count of Article Views (full-text article views including HTML views, PDF and ePub downloads, according to the available data) and Abstracts Views on Vision4Press platform.
Data correspond to usage on the plateform after 2015. The current usage metrics is available 48-96 hours after online publication and is updated daily on week days.
Initial download of the metrics may take a while.