Fig. 4
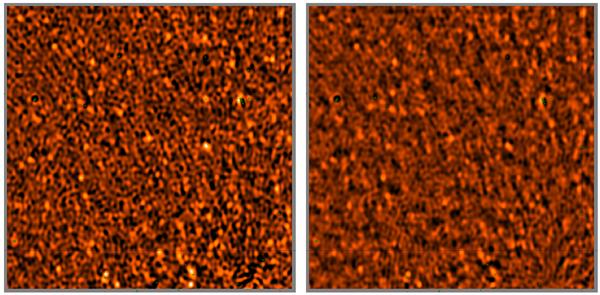
Source suppression through interferometer-based error solutions. On the left is a deconvolved 8-band residual image of the centre of the field, with 12 h solutions for Mpq. On the right is the same image with 30 min solutions. The positions of (subtracted) model sources are indicated by crosses. Suppression of unmodelled sources is evident in the right image.

Current usage metrics show cumulative count of Article Views (full-text article views including HTML views, PDF and ePub downloads, according to the available data) and Abstracts Views on Vision4Press platform.
Data correspond to usage on the plateform after 2015. The current usage metrics is available 48-96 hours after online publication and is updated daily on week days.
Initial download of the metrics may take a while.