Fig. 17
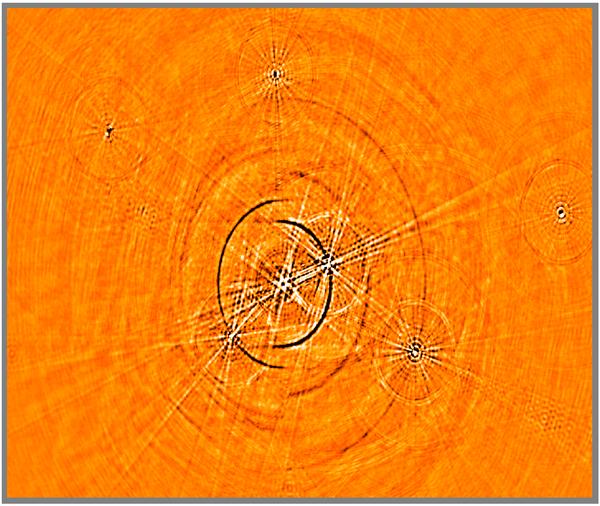
Calibration with an improved sky model. This shows the difference between the 8-band residual maps (2003 observation) produced with the original and the improved sky models. Structures around 3C 147 itself and the off-axis sources are mostly due to “selfcal contamination” in the original model caused by incorrect off-axis source positions. These are well within the noise: the intensity range of this image is ± 2 μJy, while the 8-band maps have a thermal noise of 13.5 μJy.
Current usage metrics show cumulative count of Article Views (full-text article views including HTML views, PDF and ePub downloads, according to the available data) and Abstracts Views on Vision4Press platform.
Data correspond to usage on the plateform after 2015. The current usage metrics is available 48-96 hours after online publication and is updated daily on week days.
Initial download of the metrics may take a while.