Fig. 4
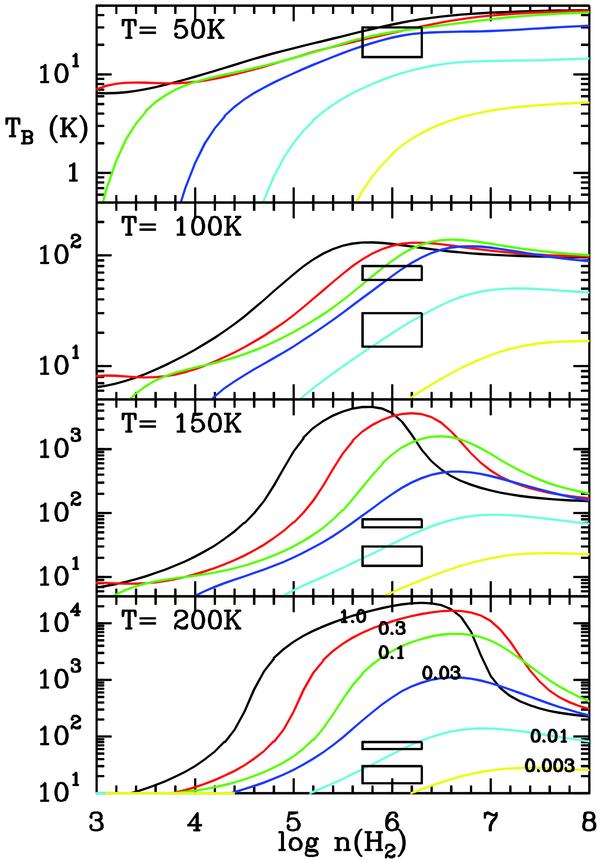
Predictions of the p-H2O 313 − 220 line intensity, in units of brightness temperature, for gas with density n(H2) in the range 103 − 108cm-3, temperature in the range 50 − 200 K, for column densities of para-water equal to 0.003 (bottom curve), 0.01, 0.03, 0.1, 0.3, 1.0 × 1019cm-2 (top curve). The range of TB − n(H2) determined in the water-emitting clumps is delineated by rectangles.
Current usage metrics show cumulative count of Article Views (full-text article views including HTML views, PDF and ePub downloads, according to the available data) and Abstracts Views on Vision4Press platform.
Data correspond to usage on the plateform after 2015. The current usage metrics is available 48-96 hours after online publication and is updated daily on week days.
Initial download of the metrics may take a while.