Fig. 3
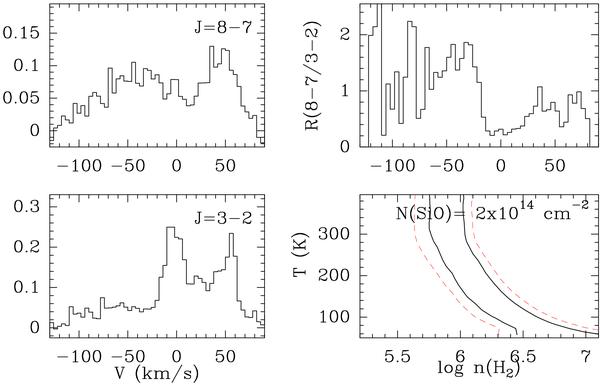
(Left) SiO emission observed in the J = 3 → 2 (bottom) and J = 8 → 7 transitions towards the protostellar source. Fluxes are expressed in units of main-beam temperature. (Right) Observed variations of the ratio of the CO J = 8 → 7 to J = 3 → 2 brigthness temperatures R(8–7/3–2) as a function of velocity (top) and predicted variations as a function of the gas density n(H2) and the kinetic temperature Tk (bottom) for a typical column density N(SiO) = 2 × 1014cm-2. The contour level R = 0.7,1.5 are drawn with a solid black line; the contours R = 0.5,1.8 are drawn with a dashed red line and account for an uncertainty of 30%.
Current usage metrics show cumulative count of Article Views (full-text article views including HTML views, PDF and ePub downloads, according to the available data) and Abstracts Views on Vision4Press platform.
Data correspond to usage on the plateform after 2015. The current usage metrics is available 48-96 hours after online publication and is updated daily on week days.
Initial download of the metrics may take a while.