Fig. 2
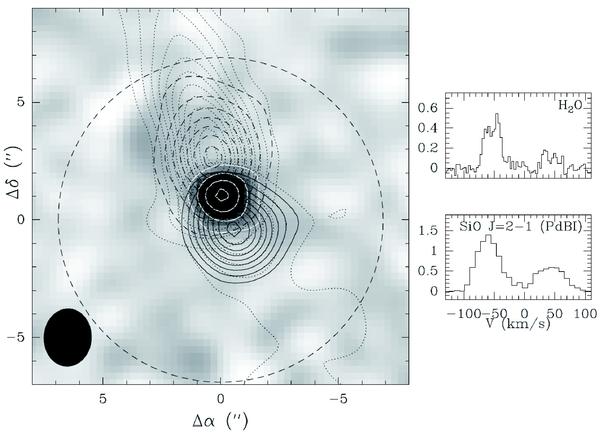
(Left) Map of the velocity-integrated SiO emission in the Cep E jet obtained at 2″ resolution with the Plateau de Bure interferometer (PdBI; Lefloch et al., in prep.). The SiO J = 2 → 1 emission integrated between + 40 and + 80kms-1 (−90 and −40kms-1) is drawn in solid (dashed) contours, superposed on the 3 mm continuum emission map (grayscale and white contours). First contour and contour interval of the jet emission are 10-2 and 5 × 10⁻³ (10-2) Jy/beam for the redshifted (blueshifted) emission. First contour and contour interval of the 3 mm continuum emission is 2 × 10⁻³ Jy/beam. The main beam of the IRAM 30 m telescope at the frequency of the p-H2O 313 − 220 line is marked by a circle (dashed). The synthesized beam of the PdBI (2.4″ × 2.0″) is indicated as a filled ellipse in the bottom right corner. (Right) Comparison of the PdBI SiO J = 2 → 1 and the average  spectra towards the protostar. Intensities are expressed in units of antenna temperature.
Current usage metrics show cumulative count of Article Views (full-text article views including HTML views, PDF and ePub downloads, according to the available data) and Abstracts Views on Vision4Press platform.
Data correspond to usage on the plateform after 2015. The current usage metrics is available 48-96 hours after online publication and is updated daily on week days.
Initial download of the metrics may take a while.