Fig. 1
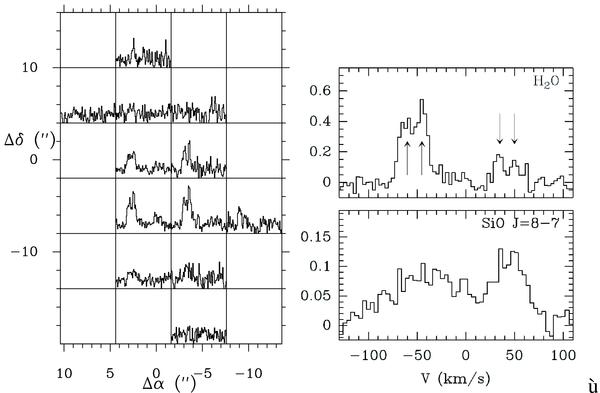
(Left) Map of the p-H2O 313 − 220 emission between − 110 and + 70kms-1 in the outflow of Cep E obtained with the IRAM 30 m telescope. Coordinates are in arcsec offsets with respect to the nominal position of the protostar. (Right) H O and SiO J = 8 → 7 emission detected towards the protostellar source. The HO emission is averaged over a region of 6″ × 6″ around the protostar. Intensities are expressed in units of antenna temperature. The different components of the spectrum are marked with arrows.
Current usage metrics show cumulative count of Article Views (full-text article views including HTML views, PDF and ePub downloads, according to the available data) and Abstracts Views on Vision4Press platform.
Data correspond to usage on the plateform after 2015. The current usage metrics is available 48-96 hours after online publication and is updated daily on week days.
Initial download of the metrics may take a while.