Fig. 2
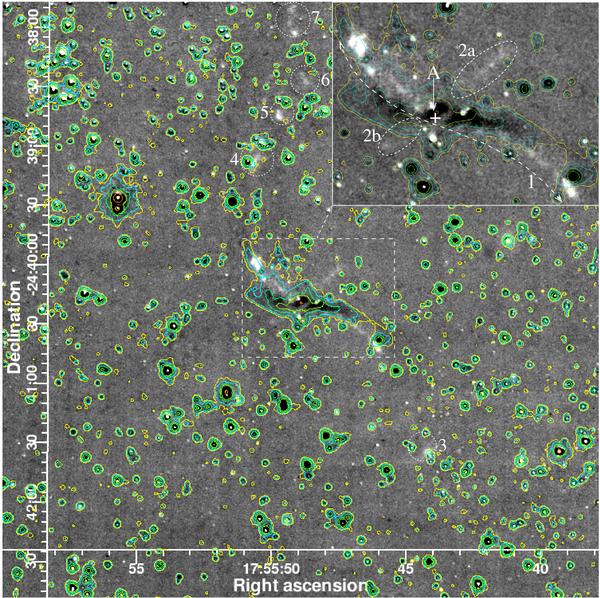
The continuum-subtracted 2.122-μm image of IRAS 17527 over a 5′ × 5′ field, smoothed with a 2-pixel FWHM Gaussian to enhance the appearance of the faint emission features. “+” shows the location of the outflow source derived from the Spitzer 5.8-μm image. The contours generated from the Spitzer 4.5-μm image are overlaid. An enlarged view of the central region is shown in the inset. The dashed line “1” shows the direction of the main outflow detected here. The ellipses “2a” and “2b” enclose H2 emission features which are probably due to a second outflow. Additional H2 emission features detected are circled and labelled “3–7”. The image scale is 0.2″ pix-1.
Current usage metrics show cumulative count of Article Views (full-text article views including HTML views, PDF and ePub downloads, according to the available data) and Abstracts Views on Vision4Press platform.
Data correspond to usage on the plateform after 2015. The current usage metrics is available 48-96 hours after online publication and is updated daily on week days.
Initial download of the metrics may take a while.