Free Access
Fig. 5
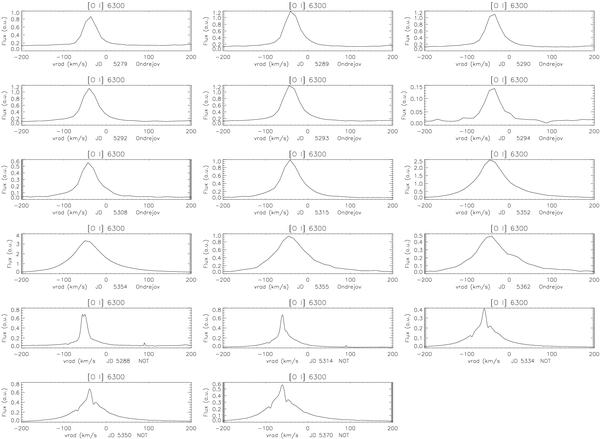
Variation of the [O I] 6300 Å line profile from the Ondřejov (11.4 km s-1px-1) and NOT (1.1 km s-1 px-1) data sets during the observing period. The date is a JD-2 450 000; the peak of the XR emission, around day 30, corresponds to JD 2 455 296.
Current usage metrics show cumulative count of Article Views (full-text article views including HTML views, PDF and ePub downloads, according to the available data) and Abstracts Views on Vision4Press platform.
Data correspond to usage on the plateform after 2015. The current usage metrics is available 48-96 hours after online publication and is updated daily on week days.
Initial download of the metrics may take a while.