Fig. 26
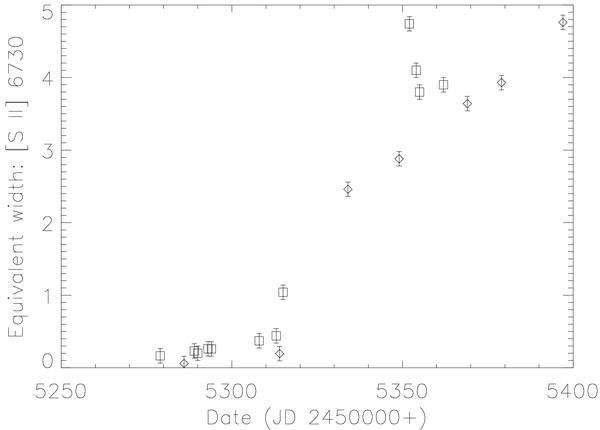
Variation of the [S II] 6730 Å equivalent with showing the shortlived “flare” event at about day 84 of the outburst. There was no profile change during this increase. Square: Ondřejov spectra, diamond: NOT spectra. Note the rapid increase in line strength approximately coincident with the peak and initial decline of the XR emission (see Fig. 1).
Current usage metrics show cumulative count of Article Views (full-text article views including HTML views, PDF and ePub downloads, according to the available data) and Abstracts Views on Vision4Press platform.
Data correspond to usage on the plateform after 2015. The current usage metrics is available 48-96 hours after online publication and is updated daily on week days.
Initial download of the metrics may take a while.