Fig. 4
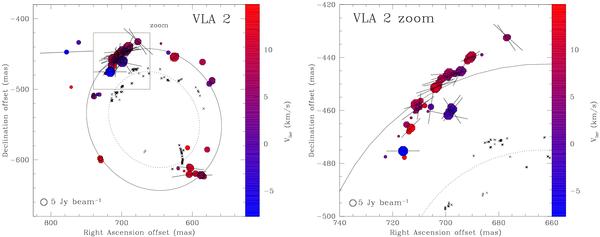
Left panel: a close-up view of the H2O maser features around the radio source VLA 2. Right panel: a zoom-in view of the boxed region of the left panel. The octagonal symbols are the identified maser features in present work scaled logarithmically according to their peak flux density. The maser LSR radial velocity is indicated by color. A 5 Jy beam-1 symbol is plotted for illustration in both panel. The linear polarization vectors, scaled logarithmically according to polarization fraction P1 (in Table 1), are overplotted. Two ellipses are also drawn in both panels. They are the results of the best fit of the water masers (crosses) detected by T03 (dotted ellipse, ellipse 1; epoch 1999) and of those detected in present work (solid ellipse, ellipse 2; epoch 2005). Their parameters are listed in Table 4. The synthesized beam is 2.0 mas × 0.7 mas.
Current usage metrics show cumulative count of Article Views (full-text article views including HTML views, PDF and ePub downloads, according to the available data) and Abstracts Views on Vision4Press platform.
Data correspond to usage on the plateform after 2015. The current usage metrics is available 48-96 hours after online publication and is updated daily on week days.
Initial download of the metrics may take a while.