Fig. 2
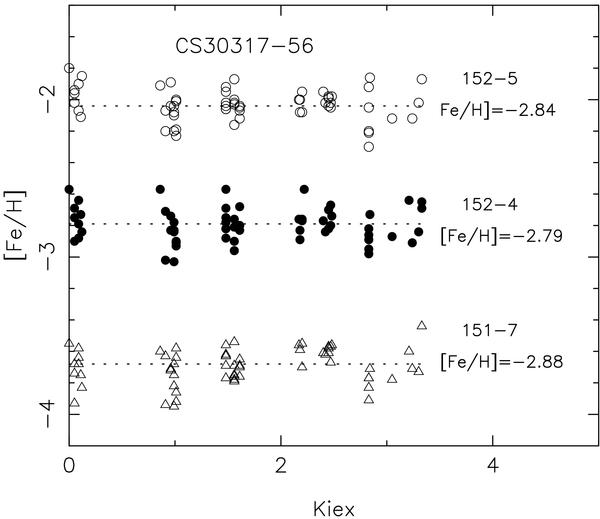
[Fe/H] vs. χex for our three blue spectra of CS 30317-56 (152-5, 152-4 and 151-7). For clarity, the plots for 151-7 and 152-5 have been shifted down and up by 0.8 dex, respectively. The computations were with the same OSMARCS model: Teff =6000 K, log g = 2.0, [M/H ] = −2.85 dex, ξt = 3 km s-1. The mean abundance from the Fe I lines is given to the right of each plot. Abundances from Fe II are [Fe/H]151−7 = −2.84 dex, [Fe/H] 152−4 = −2.84 dex, and [Fe/H] 152−5 = −2.90 dex. Accordingly, within the errors, the same model can be adopted for all spectra.
Current usage metrics show cumulative count of Article Views (full-text article views including HTML views, PDF and ePub downloads, according to the available data) and Abstracts Views on Vision4Press platform.
Data correspond to usage on the plateform after 2015. The current usage metrics is available 48-96 hours after online publication and is updated daily on week days.
Initial download of the metrics may take a while.