Fig. 6
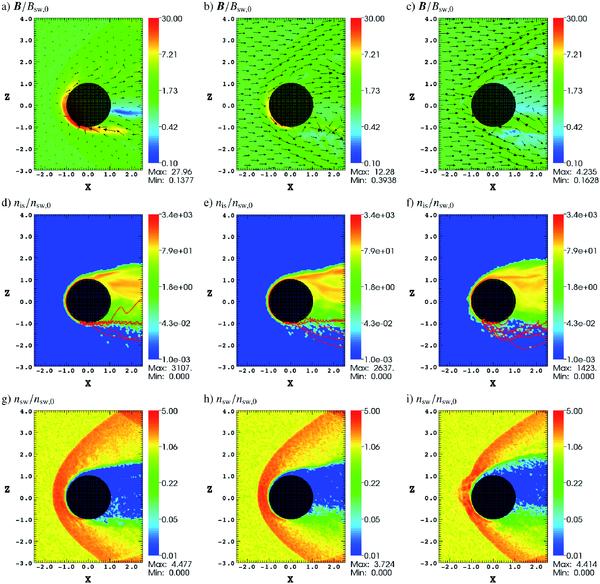
Simulation results in the form of polar plane cross-sections for the perpendicular (left column), intermediate (middle column), and quasiparallel (right column) simulation run. The first row a−c) shows the magnetic field, the second row d−f) the ionospheric density, and the third row g−i) the stellar wind density. The x and z axes are in units of Rp. A selection of ion trajectories (red) originating in the higher south pole ionosphere and projected on to the polar plane have been added to d−f). The trajectories in f) are identical to those in Fig. 8a.
Current usage metrics show cumulative count of Article Views (full-text article views including HTML views, PDF and ePub downloads, according to the available data) and Abstracts Views on Vision4Press platform.
Data correspond to usage on the plateform after 2015. The current usage metrics is available 48-96 hours after online publication and is updated daily on week days.
Initial download of the metrics may take a while.