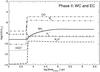
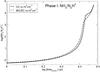
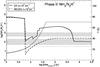
Fig. 9
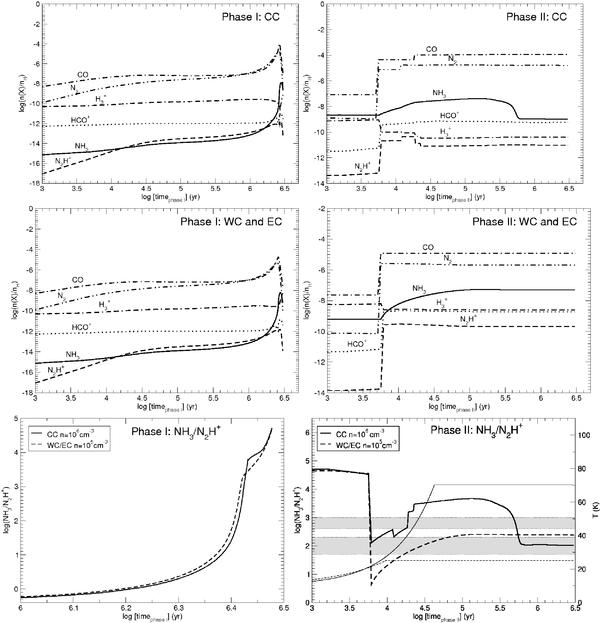
Left: fractional abundances with respect to hydrogen as a function of time during phase I for the central core (top panel) and the western/eastern cores (middle panel). The NH3/N2H+ abundance ratio for both the central core and the western/eastern core are also shown in the bottom panel. Right: same as left panels but for phase II calculation. The y-axis ranges according to the model. In the bottom right panel we also show the temperature as a function of time, indicated by the thin lines. The two shaded areas mark the range of values (400–1000 for the central core and 50–200 for the western/eastern cores) of the NH3/N2H+ abundance ratio estimated from the observational data.
Current usage metrics show cumulative count of Article Views (full-text article views including HTML views, PDF and ePub downloads, according to the available data) and Abstracts Views on Vision4Press platform.
Data correspond to usage on the plateform after 2015. The current usage metrics is available 48-96 hours after online publication and is updated daily on week days.
Initial download of the metrics may take a while.