Fig. 6
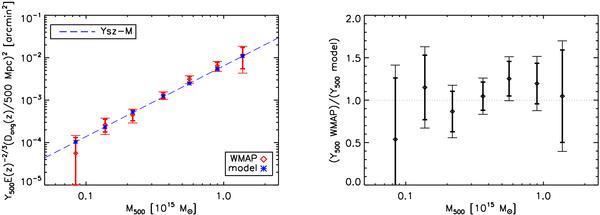
Left: zoom on the >5 × 10¹³ M⊙ mass range of the Y500−M500 relation shown in Fig. 4. The data points and model stars are now scaled with the expected redshift dependence and are placed at the mean mass of the clusters in each bin. Right: ratio between data and model.
Current usage metrics show cumulative count of Article Views (full-text article views including HTML views, PDF and ePub downloads, according to the available data) and Abstracts Views on Vision4Press platform.
Data correspond to usage on the plateform after 2015. The current usage metrics is available 48-96 hours after online publication and is updated daily on week days.
Initial download of the metrics may take a while.