Fig. 5
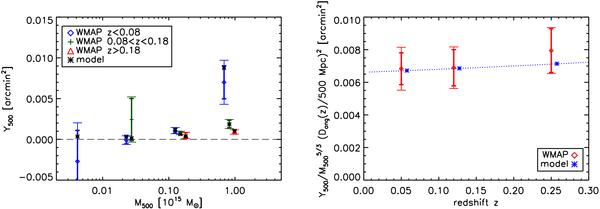
Evolution of the Y500-M500
relation. Left: the WMAP data from Fig. 4 are divided into three redshift bins:
z < 0.08 (blue diamonds),
0.08 < z < 0.18
(green crosses), z > 0.18 (red triangles).
We observe the expected trend: at fixed mass, Y500
decreases with redshift. This redshift dependence is mainly due to the angular
distance
(Y500 ∝ Dang(z)-2).
The stars give the prediction of the model. Right: we divide
Y500 by  and plot it as a function of z to search for evidence of evolution
in the Y500−M500 relation.
The thick bars give the 1σ statistical errors from WMAP data. The
thin bars give the total 1 sigma errors.
and plot it as a function of z to search for evidence of evolution
in the Y500−M500 relation.
The thick bars give the 1σ statistical errors from WMAP data. The
thin bars give the total 1 sigma errors.
Current usage metrics show cumulative count of Article Views (full-text article views including HTML views, PDF and ePub downloads, according to the available data) and Abstracts Views on Vision4Press platform.
Data correspond to usage on the plateform after 2015. The current usage metrics is available 48-96 hours after online publication and is updated daily on week days.
Initial download of the metrics may take a while.