Fig. 3
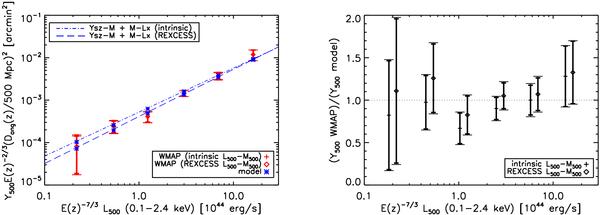
Left: bin averaged SZ flux from a sphere of radius r500 (Y500) as a function of X-ray luminosity in a aperture of r500 (L500). The WMAP data (red diamonds and crosses), the SZ cluster signal expected from the X-ray based model (blue stars) and the combination of the Y500−M500 and L500−M500 relations (dash and dotted dashed lines) are given for two analyses, using respectively the intrinsic L500−M500 and the REXCESS L500−M500 relations. As expected, the data points do not change significantly from one case to the other showing that the Y500-L500 relation is rather insensitive to the finer details of the underlying L500−M500 relation. Right: ratio of data points to model for the two analysis. The points for the analysis undertaken with the intrinsic L500−M500 are shifted to lower luminosities by 20% for clarity.
Current usage metrics show cumulative count of Article Views (full-text article views including HTML views, PDF and ePub downloads, according to the available data) and Abstracts Views on Vision4Press platform.
Data correspond to usage on the plateform after 2015. The current usage metrics is available 48-96 hours after online publication and is updated daily on week days.
Initial download of the metrics may take a while.