Fig. 2
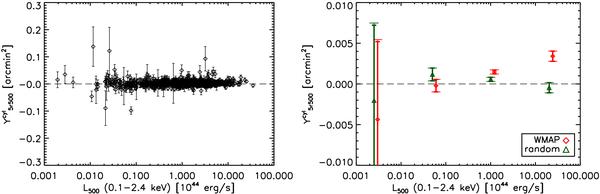
Left: estimated SZ flux from a cylinder of aperture radius
5 × r500 ( ) as
a function of the X-ray luminosity in an aperture of
r500 (L500), for the 893
NORAS/REFLEX clusters. The individual clusters are barely detected. The bars give
the total 1σ error. Right: Red diamonds are the
weighted average signal in 4 logarithmically-spaced luminosity bins. The two high
luminosity bins exhibit significant SZ cluster flux. Note that we have divided the
vertical scale by 30 between Fig. left and right. The thick and thin bars give the
1σ statistical and total errors, respectively. Green triangles
(shifted up by 20% with respect to diamonds for clarity) show the result of the same
analysis when the fluxes of the clusters are estimated at random positions instead
of true cluster positions.
) as
a function of the X-ray luminosity in an aperture of
r500 (L500), for the 893
NORAS/REFLEX clusters. The individual clusters are barely detected. The bars give
the total 1σ error. Right: Red diamonds are the
weighted average signal in 4 logarithmically-spaced luminosity bins. The two high
luminosity bins exhibit significant SZ cluster flux. Note that we have divided the
vertical scale by 30 between Fig. left and right. The thick and thin bars give the
1σ statistical and total errors, respectively. Green triangles
(shifted up by 20% with respect to diamonds for clarity) show the result of the same
analysis when the fluxes of the clusters are estimated at random positions instead
of true cluster positions.
Current usage metrics show cumulative count of Article Views (full-text article views including HTML views, PDF and ePub downloads, according to the available data) and Abstracts Views on Vision4Press platform.
Data correspond to usage on the plateform after 2015. The current usage metrics is available 48-96 hours after online publication and is updated daily on week days.
Initial download of the metrics may take a while.