Fig. 1
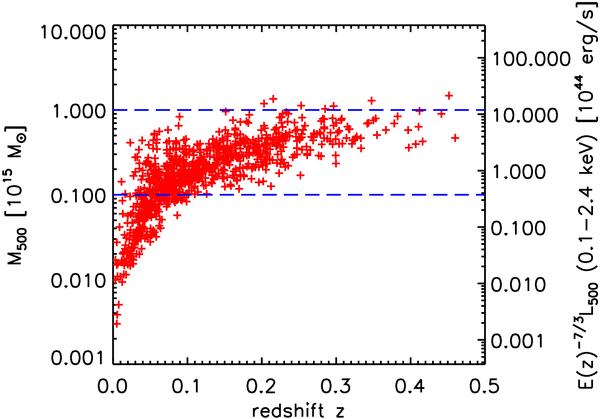
Inferred masses for the 893 NORAS/REFLEX clusters as a function of redshift. The cluster sample is flux limited. The right vertical axis gives the corresponding X-ray luminosities scaled by E(z)−7/3. The dashed blue lines delineate the mass range over which the L500−M500 relation from Pratt et al. (2009) was derived.
Current usage metrics show cumulative count of Article Views (full-text article views including HTML views, PDF and ePub downloads, according to the available data) and Abstracts Views on Vision4Press platform.
Data correspond to usage on the plateform after 2015. The current usage metrics is available 48-96 hours after online publication and is updated daily on week days.
Initial download of the metrics may take a while.