Free Access
Fig. 3
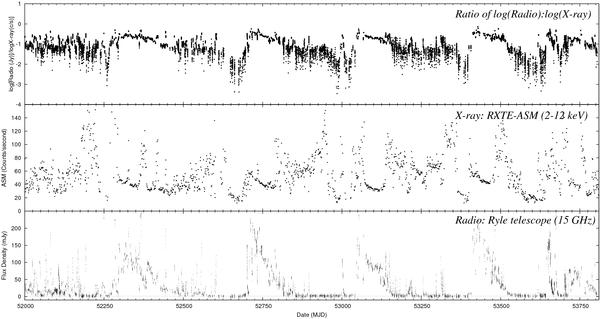
The radio and X-ray lightcurves (bottom and middle respectively) of five long periods of outburst. The top graph represents the ratio of log(radio)/log(X-ray), clearly showing direct relationship between the two bands.
Current usage metrics show cumulative count of Article Views (full-text article views including HTML views, PDF and ePub downloads, according to the available data) and Abstracts Views on Vision4Press platform.
Data correspond to usage on the plateform after 2015. The current usage metrics is available 48-96 hours after online publication and is updated daily on week days.
Initial download of the metrics may take a while.