Fig. 2
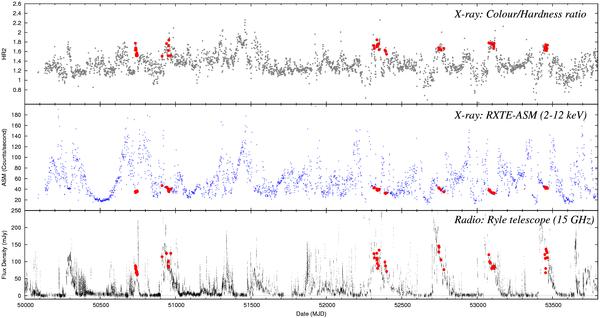
X-ray and radio lightcurves of GRS 1915+105 over a ten year period with the red marks representing persistent radio emission associated with class χ or the “plateau” state (i.e. ASM counts of 30 − 50 per second and HR2 > 1.5); the bottom graph shows 15 GHz radio observations taken by the Ryle Telescope, the middle and top graphs show 2 − 12 keV X-ray and HR2 hardness ratio  respectively observations taken with the RXTE-ASM.
Current usage metrics show cumulative count of Article Views (full-text article views including HTML views, PDF and ePub downloads, according to the available data) and Abstracts Views on Vision4Press platform.
Data correspond to usage on the plateform after 2015. The current usage metrics is available 48-96 hours after online publication and is updated daily on week days.
Initial download of the metrics may take a while.