Fig. 1
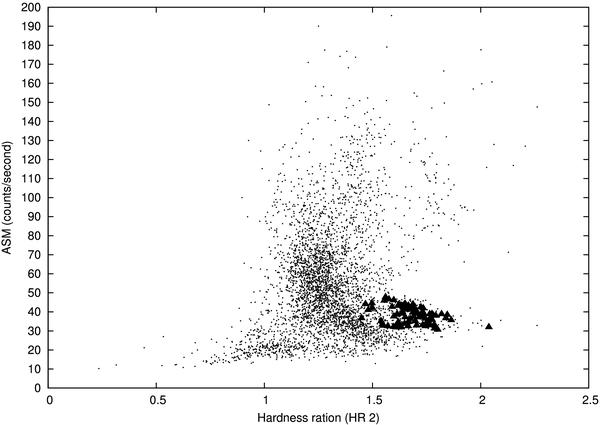
Hardness intensity diagram of GRS 1915+105 between 1996 and 2008, showing the one day average intensity, between 2 − 12 keV, plotted as a function of the hardness radio, HR2  ). The triangles represent persistent radio emission associated with the X-rays known as class χ by Belloni et al. (2000) and the “plateau” state by Pooley & Fender (1997).
Current usage metrics show cumulative count of Article Views (full-text article views including HTML views, PDF and ePub downloads, according to the available data) and Abstracts Views on Vision4Press platform.
Data correspond to usage on the plateform after 2015. The current usage metrics is available 48-96 hours after online publication and is updated daily on week days.
Initial download of the metrics may take a while.