Fig. 2
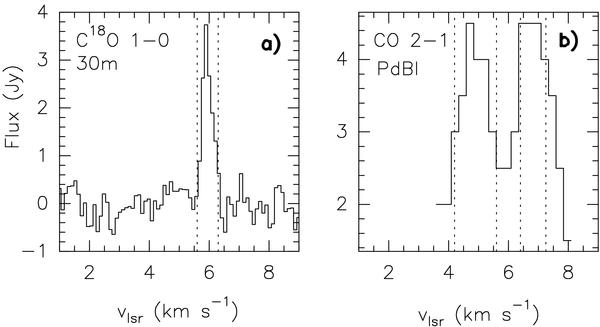
a) Spectra of the C18O 1 → 0 line toward AB Aur observed with the IRAM 30 m telescope by Fuente et al. (2002). We adopted this profile as a pattern profile for the ambient cloud emission. Vertical lines indicate the velocity interval [5.6, 6.4] km s-1. b) Interferometric spectra of the 12CO 2 → 1 toward the star position (Fig. 2 (bottom) of Piétu et al. 2005). Note that the disk emission occurs at the velocity intervals, [4.2, 5.6] km s-1 and [6.4, 7.25] km s-1. These velocities are indicated by vertical dashed lines.
Current usage metrics show cumulative count of Article Views (full-text article views including HTML views, PDF and ePub downloads, according to the available data) and Abstracts Views on Vision4Press platform.
Data correspond to usage on the plateform after 2015. The current usage metrics is available 48-96 hours after online publication and is updated daily on week days.
Initial download of the metrics may take a while.