Fig. 8
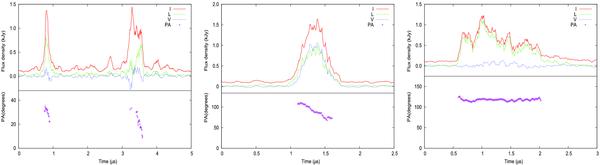
Smoothed profiles and position angle (PA) evolution for selected MPGP (left), peculiar MPGP (middle, see Sect. 4.5), and IPGP (right). The IPGP shown was detected at 15.1 GHz, while the MPGPs were found at 8.5 GHz. PA is in degrees (Y-axis), and intensity is in kJy. The solid red line indicates the total intensity, the dashed green line the linear polarization, the dashed blue line the circular polarization, and black crosses the PA variation.
Current usage metrics show cumulative count of Article Views (full-text article views including HTML views, PDF and ePub downloads, according to the available data) and Abstracts Views on Vision4Press platform.
Data correspond to usage on the plateform after 2015. The current usage metrics is available 48-96 hours after online publication and is updated daily on week days.
Initial download of the metrics may take a while.