Free Access
Fig. 11
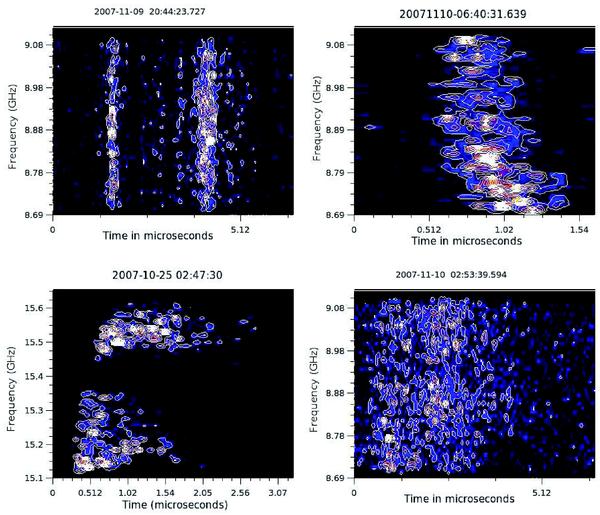
Dynamic spectra of selected GPs. Left plots show the typical examples of dynamic spectra for MPGPs (top) and IPGPs (bottom). Right plots show the peculiar GPs detected at 8.5 GHz at the longitude of MP (top, GP 639) and IP (bottom, GP 594).
Current usage metrics show cumulative count of Article Views (full-text article views including HTML views, PDF and ePub downloads, according to the available data) and Abstracts Views on Vision4Press platform.
Data correspond to usage on the plateform after 2015. The current usage metrics is available 48-96 hours after online publication and is updated daily on week days.
Initial download of the metrics may take a while.