Fig. 1
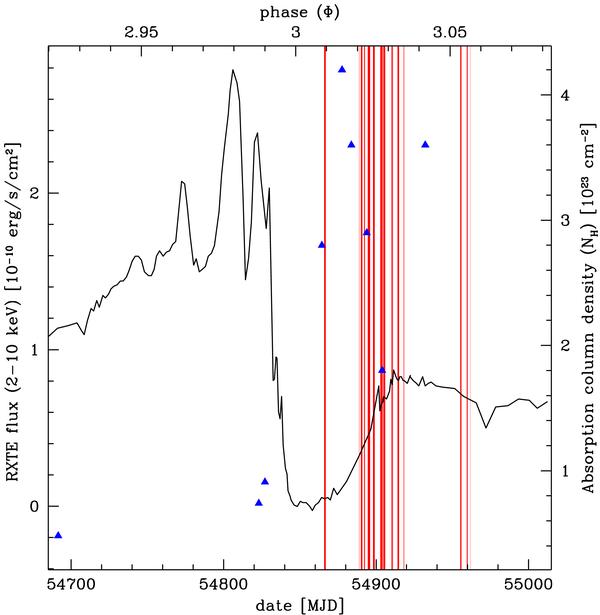
RXTE lightcurve of η Carinae (in the 2–10 keV energy range), from August 2008 to June 2009, corrected for instrumental background (from Corcoran et al. 2010, in prep.). The bottom axis gives the time in MJD, while the top axis gives the phase of η Car (based on the ephemeris from Corcoran 2005). The start of the minimum is close to the periastron passage from 2009 (Φ = 3). Red lines indicate the new INTEGRAL observations, obtained just after the X-ray minimum. Blue triangles are the NH measured during the previous minimum (with their axis on the right side), as reported by Hamaguchi et al. (2007).
Current usage metrics show cumulative count of Article Views (full-text article views including HTML views, PDF and ePub downloads, according to the available data) and Abstracts Views on Vision4Press platform.
Data correspond to usage on the plateform after 2015. The current usage metrics is available 48-96 hours after online publication and is updated daily on week days.
Initial download of the metrics may take a while.