Fig. 5
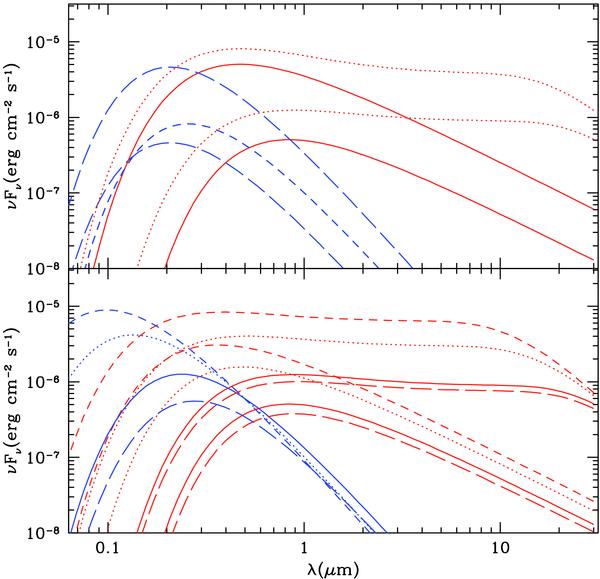
Spectra of protostellar models (see text). Top panel: for the fiducial accretion rate model with m∗ = 10 M⊙, the fluxes from the star and boundary layer are shown by the dashed and lower long-dashed lines, respectively. The lower solid line shows the flux from the accretion disk (integrating out to 5000 r∗) assuming negligible protostellar heating, while the lower dotted line shows the case accounting for protostellar heating. The upper long-dashed, solid, and dotted lines show the equivalent quantities for the model with the accretion rate enhanced by a factor of 10. Bottom panel: the solid lines show for the fiducial m∗ = 10 M⊙ model the flux from the star + boundary layer, nonirradiated and irradiated accretion disks. The long-dashed, dotted, and dashed lines show the equivalent fluxes from the fiducial accretion rate models with m∗ = 8,15, and 20 M⊙, respectively. In all cases, the flux at 2.3 μm is dominated by disk emission.
Current usage metrics show cumulative count of Article Views (full-text article views including HTML views, PDF and ePub downloads, according to the available data) and Abstracts Views on Vision4Press platform.
Data correspond to usage on the plateform after 2015. The current usage metrics is available 48-96 hours after online publication and is updated daily on week days.
Initial download of the metrics may take a while.