Fig. 1
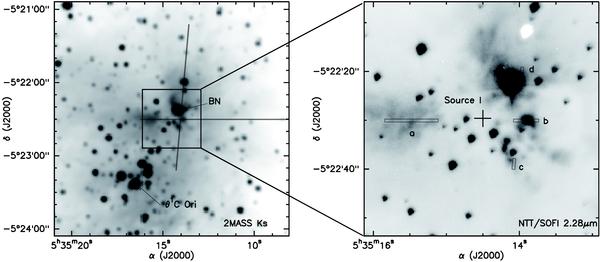
Left panel: 2MASS Ks-band image of the Orion Trapezium and the Kleinmann-Low nebula region, θ1 C and the Becklin-Neugebauer object are marked for reference. The positions of the two on-source slits are shown. Right panel: the region around Orion-KL source I (marked with a cross and labeled) at 2.28 μm is reproduced from an ESO-Archive SOFI-NTT observation (originally acquired for the ESO program 64.I-0493). The small slitlets marked from a to d show the regions we used to extract the spectra shown in Fig. 2.
Current usage metrics show cumulative count of Article Views (full-text article views including HTML views, PDF and ePub downloads, according to the available data) and Abstracts Views on Vision4Press platform.
Data correspond to usage on the plateform after 2015. The current usage metrics is available 48-96 hours after online publication and is updated daily on week days.
Initial download of the metrics may take a while.