![\begin{figure}
\par\includegraphics[width=6.5cm,clip]{0633fig1.ps}\par\includegraphics[width=6.5cm,clip]{0633fig2.ps}
\end{figure}](/articles/aa/full/2009/04/aa10633-08/Timg42.gif) |
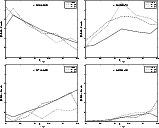
Figure 1:
Sky coverage maps of the NIR datasets in the Groth and HDFN fields. The outlines represent. Top - The CAHA- |
| Open with DEXTER | |
In the text
![\begin{figure}
\par\includegraphics[width=9cm,clip]{0633fig3.eps}
\end{figure}](/articles/aa/full/2009/04/aa10633-08/Timg68.gif) |
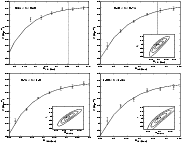
Figure 2:
The K-band best fit to the point source completeness curves. Point-like sources were inserted at random locations in the images. The completeness is defined as the fraction of recovered sources in each image. The short dashed line shows the completeness curve for the Groth32 pointing, the shallowest frame employed computing the number counts. The vertical long dashed line at K=18.5 depicts the magnitude threshold to which our catalog is |
| Open with DEXTER | |
In the text
![\begin{figure}
\par\includegraphics[angle=0,width=8.8cm,clip]{0633fig4.eps}
\end{figure}](/articles/aa/full/2009/04/aa10633-08/Timg82.gif) |
Figure 3: Efficiency of the BzK color-color diagram to identify stars, compared to the combination of the other 9 criteria applied to isolate stars. The dashed lines depict the regions defined by the BzK criteria. The bottom line isolates the stellar locus, while the other two select sources at z > 1.4. Black stars show the sources that satisfy three or more stellarity criteria. |
| Open with DEXTER | |
In the text
![\begin{figure}
\par\includegraphics[angle=0,width=8cm,clip]{0633fig5.eps}
\end{figure}](/articles/aa/full/2009/04/aa10633-08/Timg105.gif) |
Figure 4:
Comparison of the scattering in the photometric redshift estimates (
|
| Open with DEXTER | |
In the text
![\begin{figure}
\par\includegraphics[width=8.8cm,clip]{0633fig6.eps}
\end{figure}](/articles/aa/full/2009/04/aa10633-08/Timg109.gif) |
Figure 5: Photometric redshift distributions of the K-band selected galaxies in the HDFN, CDFS and Groth fields. |
| Open with DEXTER | |
In the text
![\begin{figure}
\par\includegraphics[width=8.8cm,clip]{0633fig7.eps}
\end{figure}](/articles/aa/full/2009/04/aa10633-08/Timg110.gif) |
Figure 6: The raw number counts in our three fields (HDFN, CDFS, Groth) and counts from CH03 obtained in an small portion of our total area in the Groth field. Error bars are derived from a combination of Poisson errors and bootstrapping. No completeness corrections have been made. |
| Open with DEXTER | |
In the text
![\begin{figure}
\par\mbox{\includegraphics[width=8cm,clip]{0633fig8.eps} \includegraphics[width=8cm,clip]{0633fig9.eps} }\end{figure}](/articles/aa/full/2009/04/aa10633-08/Timg133.gif) |
Figure 7: Left: averaged K-band number counts from Groth, HDFN and CDFS compared with a compilation of results taken from various sources. Right: slope for the differential number counts in our three fields, along with data from the literature. The horizontal dashed lines indicates the value of the slope at both sides of K=17.5 reported in CH03. |
| Open with DEXTER | |
In the text
![\begin{figure}
\par\includegraphics[width=8cm,clip]{0633fig10.eps}
\end{figure}](/articles/aa/full/2009/04/aa10633-08/Timg134.gif) |
Figure 8: Slope for the differential number counts in the 100 samples of the Millennium simulation drawn from the mock catalogs of Kitzbichler & White (2007). The thick dashed line shows the averaged NCs combining all the samples. |
| Open with DEXTER | |
In the text
![\begin{figure}
\par\includegraphics[width=8cm,clip]{0633fig11.eps}
\end{figure}](/articles/aa/full/2009/04/aa10633-08/Timg136.gif) |
Figure 9:
NCs in the K-band for the CDFS field alone (thick black line) and NCs in several photo-redshift ranges. At bright magnitudes ( |
| Open with DEXTER | |
In the text
 |
Figure 10: Relative contribution to the K-band number counts in redshift bins for the samples in the HFDN, CDFS and Groth field. Field-to-field differences can reach the 40% for the most prominent LSS features. |
| Open with DEXTER | |
In the text
 |
Figure 11:
LFs derived from the observed K-band in different redshift slices. The LF with the
|
| Open with DEXTER | |
In the text
![\begin{figure}
\par\mbox{\includegraphics[width=8.8cm,clip]{0633fig20.eps} \includegraphics[width=8.8cm,clip]{0633fig21.eps} }\end{figure}](/articles/aa/full/2009/04/aa10633-08/Timg236.gif) |
Figure 12:
Evolution with redshift of the
Schechter parameters |
| Open with DEXTER | |
In the text
 |
Figure 13:
Multi-wavelength evolution of the
Schechter parameters
|
| Open with DEXTER | |
In the text
![\begin{figure}
\par\mbox{\includegraphics[width=8.5cm,clip]{0633fig24.eps}\hspace*{2mm}
\includegraphics[width=8.5cm,clip]{0633fig25.eps} }\end{figure}](/articles/aa/full/2009/04/aa10633-08/Timg253.gif) |
Figure 14:
Left: K-band NCs derived from the LFs (thick black line) compared to data from other authors (the legend as in the left panel of Fig. 7). The shaded region indicates the 1 |
| Open with DEXTER | |
In the text